

Trades Analytics and Transaction Ledger
Firewire Analytics provides continuous tracking of all investment transactions across broker accounts. The Trades Activity widget and transaction ledger enable investors to review purchase and sale patterns, analyze rebalancing behavior, and assess impact on money-weighted returns.
The trades activity widget is available on the Main Dashboard (via Bento Grid) and inside the dedicated Trades view. Hovering over a period bar displays bought and sold securities, tickers, quantities, and fiat amounts. Transactions arrive via broker APIs (in real time over WebSocket for BCS) or report imports with protection against repeated records.
1. Trades Activity Widget
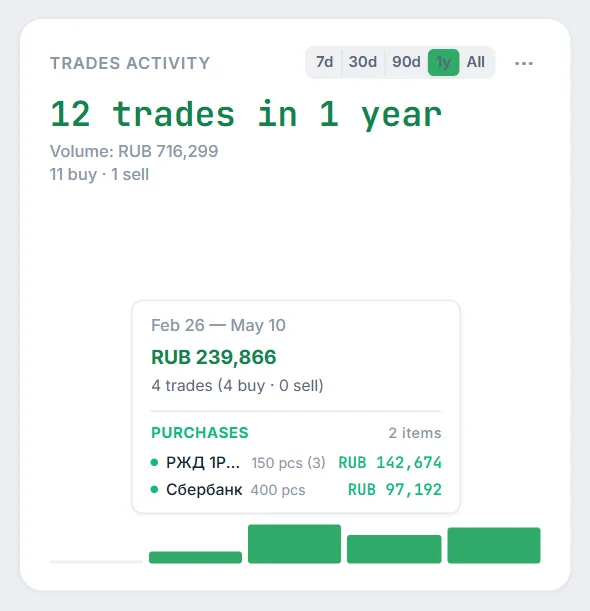
The widget shows how your trades are distributed over time. Pick the period with the 7d, 30d, 90d, 1y and All buttons:
- Period summary: number of trades, total volume in rubles, and the buy/sell split.
- Bar chart: on the dashboard the period is split into 5 equal intervals and bar height reflects activity in each; clicking a bar opens the Trades section filtered to those dates. In the Trades section the widget draws daily bars, with buys in green and sells in red.
- Interactive Breakdown Tooltip: hovering over a bar reveals a popover with:
- Interval dates, volume, and total number of trades;
- Buys: instruments grouped by ticker with quantity, trade count, and amount;
- Sells: the same list for sold instruments;
- Compact Mode: instruments are sorted by amount; beyond 5 (4 in the Trades section) the rest collapse into a “+ N more” line.
2. Transaction Ledger and Filtering
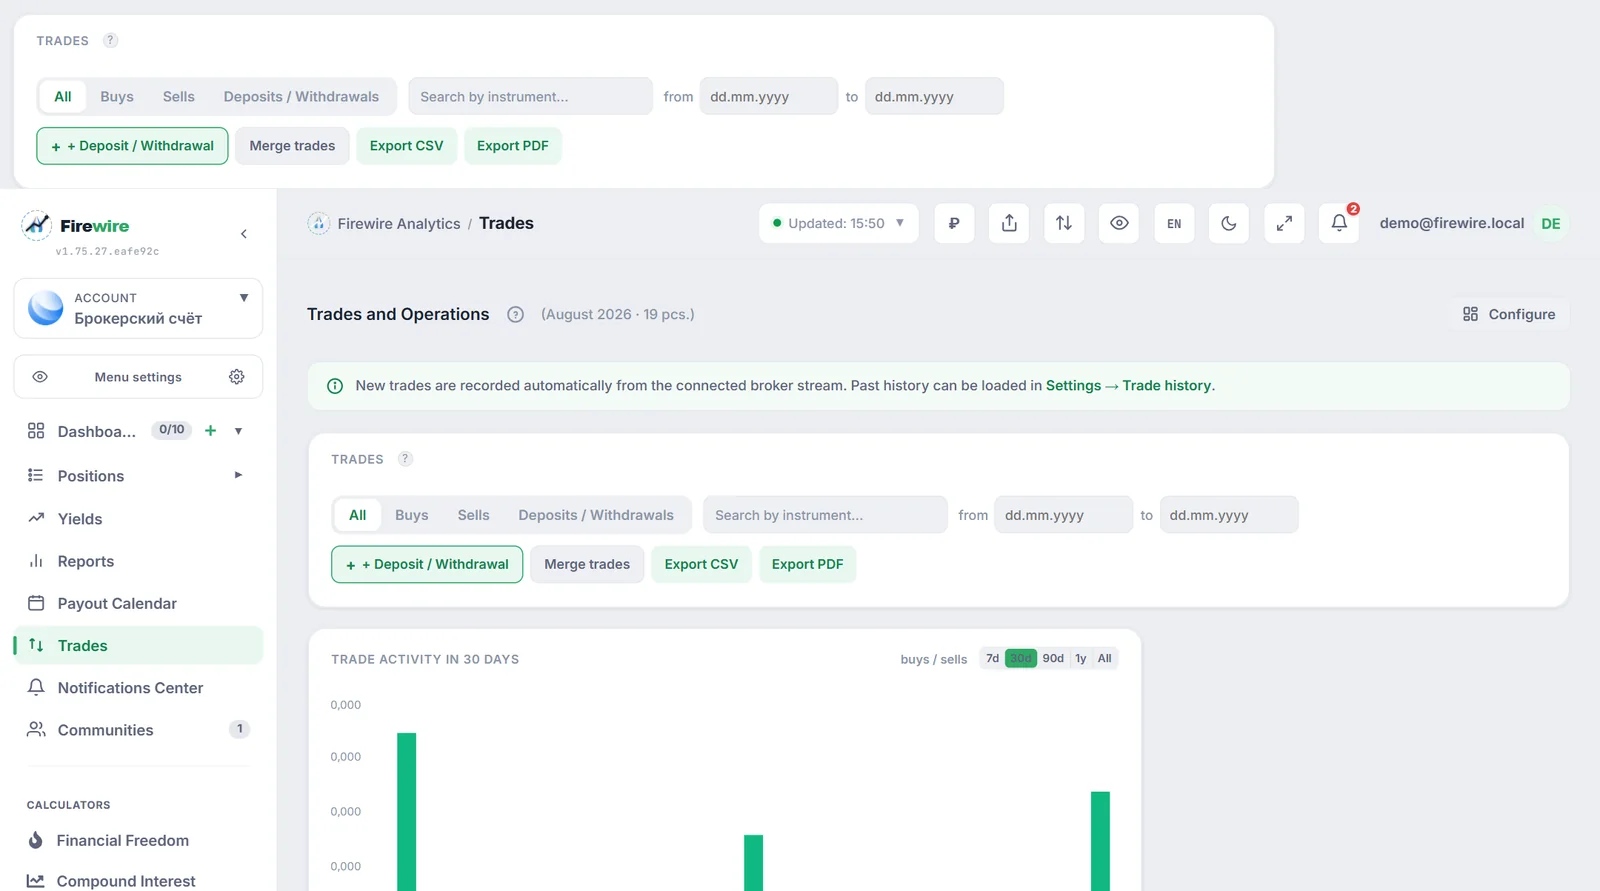
Inside the Trades section, investors access an immutable chronological record of all operations:
| Parameter | Description | Value for Investor |
|---|---|---|
| Account Selector | Filter by specific broker account or aggregated multi-account view | Segregate taxable accounts, IIS tax-advantaged accounts, and crowdlending. |
| Ticker & Asset Search | Instant search by ticker symbol, ISIN, or company name | Inspect complete entry and exit history for individual securities. |
| Non-trade cash ops (Deposits / Withdrawals) | Tracking cash deposits and withdrawals with distinct color badges and comments | Control liquidity flows without distorting trade turnover or commissions. |
| Fees & Accrued Interest | Tracks broker fees, exchange commissions, and bond accrued interest (NKD) | Accurate cost accounting when evaluating net profit and loss. |
| Data Export | Export filtered transactions to CSV («Export CSV») or print the ledger to PDF («Export PDF») | Effortless preparation for tax reporting and external portfolio auditing. |
3. Trade Markers & Volume Share on Price Charts
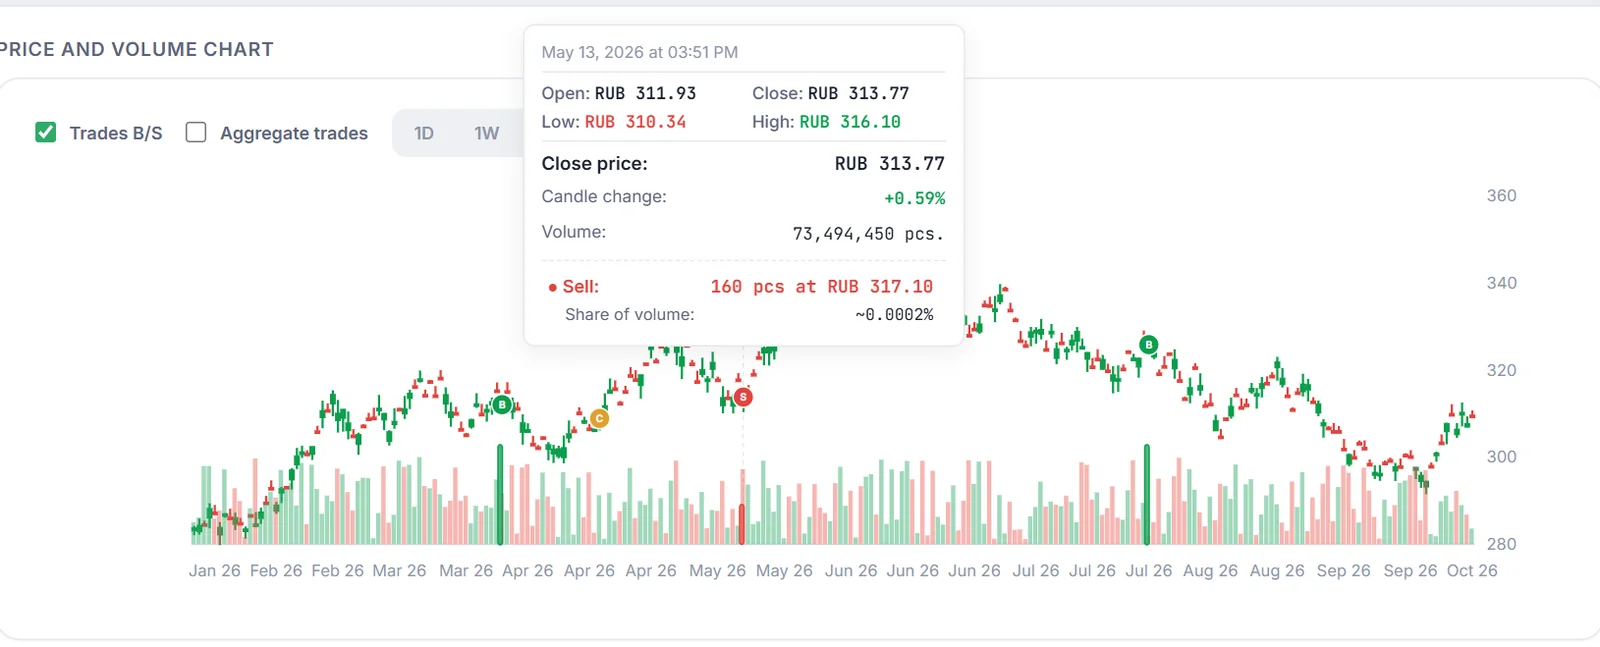
On detailed candlestick charts of instruments (bonds, equities, ETFs), execution points are mapped directly onto the timeline and candles:
- Interactive Trade Markers: purchases are highlighted with emerald
B(Buy) markers below candles, and sales with coralS(Sell) markers above candles. - “Share of volume:” Indicator: for every individual trade, the tooltip calculates the exact percentage of the trade volume relative to the day's total market turnover:
- For bonds: trade monetary value in rubles is compared with candle trading volume in rubles (the broker-reported amount, or else price in % of par × par × quantity; accrued interest is not included);
- For stocks & ETFs: trade quantity in shares is matched against total daily candle volume in shares;
- Smart micro-share formatting: trades in highly liquid instruments use adaptive precision (e.g.
~0.0002%instead of a misleading zero, or<0.0001%for fractional shares); - Trade Aggregation Mode: grouping multiple executions on a candle calculates the total aggregated volume share of buys and sells.
4. Data Ingestion and Intelligent Deduplication
Firewire aggregates trades via multiple ingestion channels:
- Real-Time WebSocket Streaming (BCS Trade API): exchange executions stream directly via a secure WSS connection without manual page refresh.
- Scheduled API Synchronization: automated reconciliation with official broker gateways.
- Broker Report Ingestion: BCS, T-Investments and Finam reports are uploaded with «Import report» in Settings (XLSX, XLS, CSV); other brokers' statements go through AI Copilot (PDF, Excel, CSV).
- Duplicate Protection: trades already stored are skipped — by the broker's execution ID when available, otherwise by
ticker + timestamp + side + quantity + price. Trades whose time or price differ between sources may not be recognized as repeats.
5. Impact on Financial Metrics and Yield Formulas
Every recorded execution automatically feeds into platform calculation engines:
- Average Cost Basis: purchases update open position cost basis using weighted average calculation.
- Cash Flow in XIRR: buy and sell transactions serve as capital inflows and outflows anchored to exact settlement dates.
- Realized PnL in PnL Decomposition: position closes crystallize capital gain/loss after net fee subtraction.
- AI Copilot Alerts: monitors recent turnover to warn against excessive asset concentration and emotional trading.
6. Frequently Asked Questions (FAQ)
What does “Share of volume:” mean in the chart tooltip?
It reveals what fraction of the security's total daily trading volume your transaction (or aggregated trades) accounted for. This allows instant assessment of instrument liquidity and market impact.
How do non-trade cash operations affect trade statistics?
They are tracked in the ledger for cash flow oversight and portfolio yield calculation, but are completely isolated from trade statistics: they do not distort trading turnover, buy/sell ratios, or broker commission tallies.
Why does the tooltip display limited trades for busy days?
To preserve visual clarity on screens of any size, the tooltip shows the instruments with the largest amounts per direction (up to 5 on the dashboard, up to 4 in the Trades section) and collapses the rest into a “+ N more” line. The complete list of executions is always available in the full ledger table below.
Are broker commissions included in trade totals?
Yes. While the tooltip displays gross asset turnover for readability, the complete ledger table itemizes broker and exchange commissions, automatically factoring them into net PnL and XIRR.
How can I add the trades activity widget to my dashboard?
Go to the Main Dashboard, click “Configure”, open the widget library, and place the “Trades Activity” card (TradesActivityCard). Learn more in the Bento Grid Guide.