

Bond Analysis & Financial Instrument Card
The instrument detail card in Firewire Analytics consolidates real-time market quotes, personal execution history, scheduled coupon and amortization cash flows, interactive ruler analysis, and an embedded Yield to Maturity (YTM) calculator.
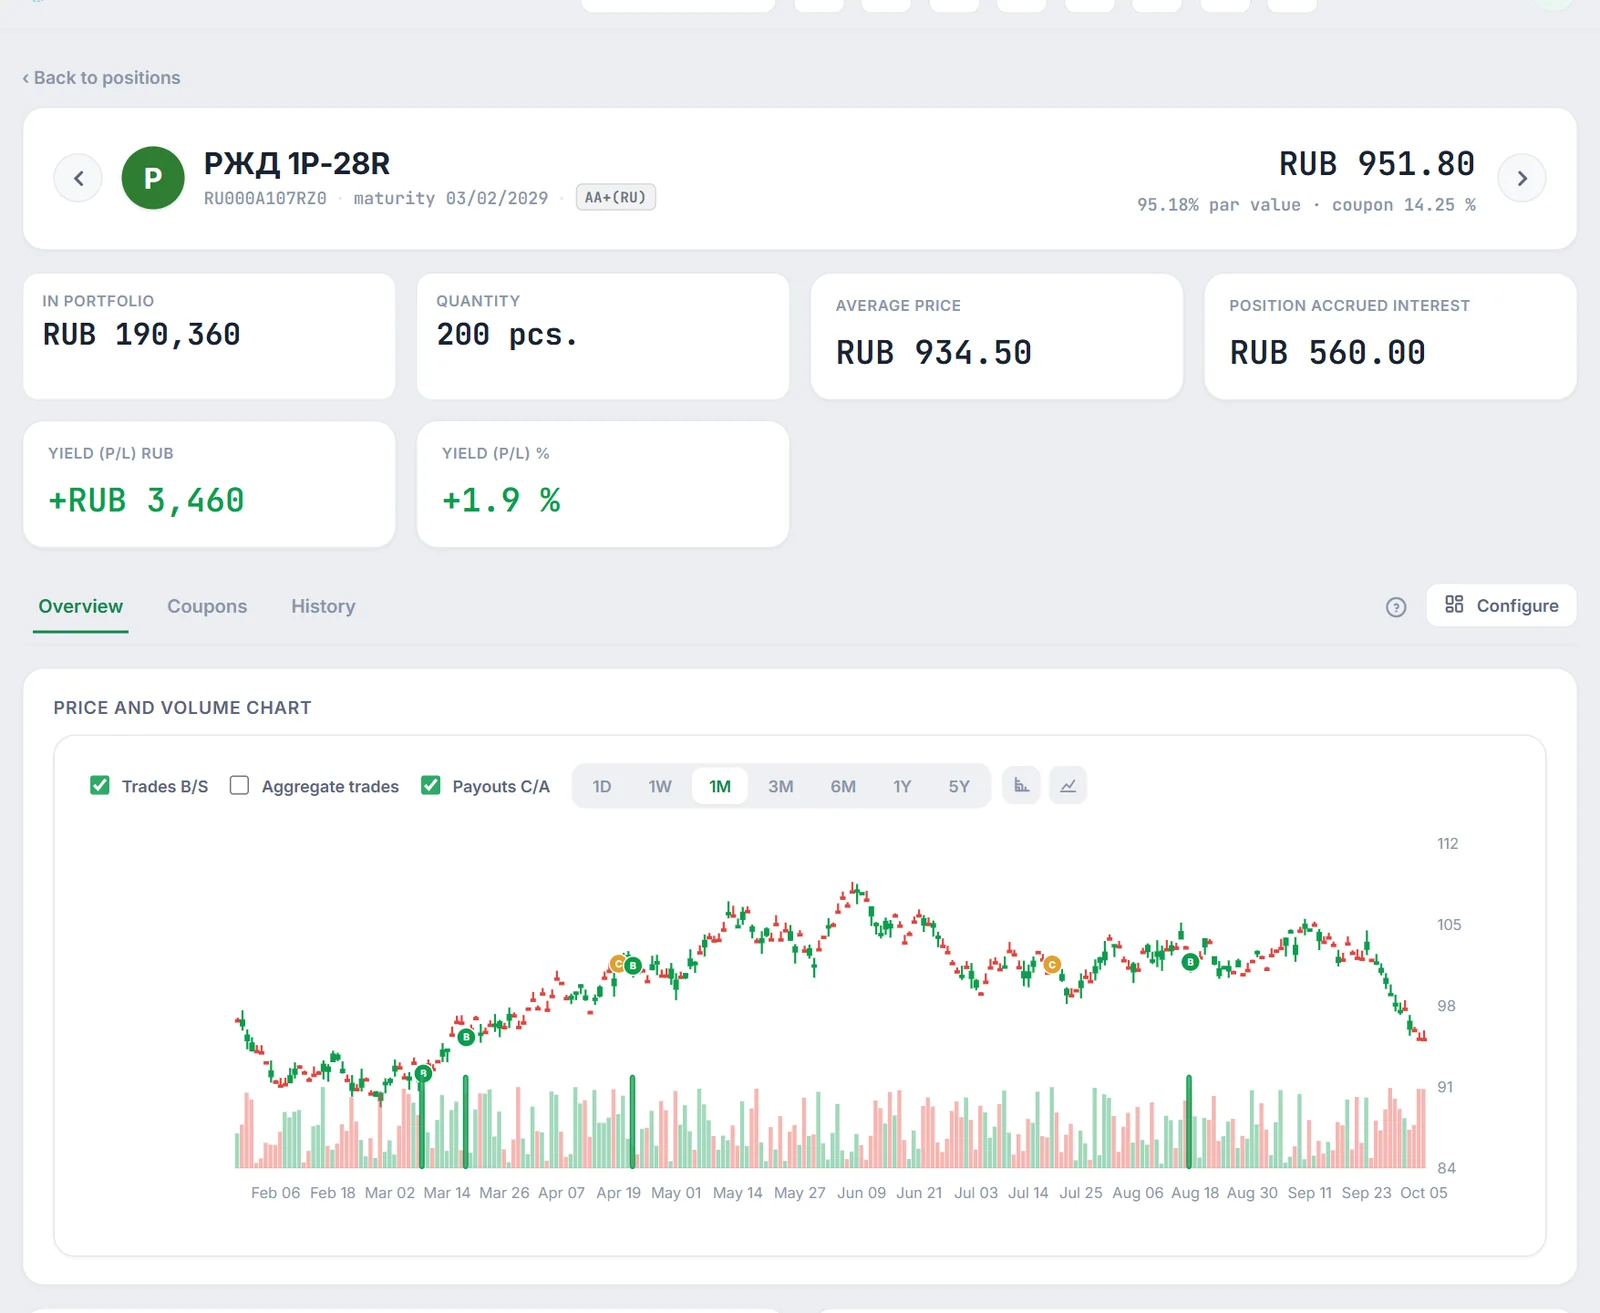
Clicking any position in your portfolio or screener opens the instrument detail view. Built on modular Bento Grid principles, the price chart, summary statistics, issue parameters, coupon matrix, and calculator can be customized to your preference. Investors easily inspect entry and exit points (B for Buys, S for Sells), verify liquidity share in trading sessions, and measure exact returns via the Ruler tool.
1. Modular Bento Grid Layout
The asset overview tab is organized as a dynamic, responsive Bento Grid containing key modules:
- Price & Volume Chart: core analytical canvas with candlestick or line representations, exchange volume bars, and overlaid trade events;
- Key Metrics: current clean price (% and currency), Yield to Maturity (YTM), current coupon yield, Macaulay and modified duration (Duration analysis), and spread over sovereign benchmarks (Z-spread);
- Upcoming Cash Flow: next coupon date or principal amortization, coupon type (constant or variable), and exact payout per bond and total position;
- Yield Calculator: interactive simulator computing net profit for target purchase sizes, reinvestment scenarios, and tax deductions;
- Issue Specifications: par value, maturity date, payment frequency, outstanding issue volume, and credit rating tiers (Credit Risk & HY).
2. Interactive Price & Volume Chart
The price chart offers deep interactivity and institutional-grade visualization tools:
- Candlestick and Line Modes: toggle between OHLC candles and smoothed area line charts with gradient fills via the chart toolbar;
- Multi-Timeframe Analysis: quickly switch intervals —
1D(intraday),1W,1M,3M,6M,1Y, and5Y(all trading history); - Adaptive Mouse Wheel Zoom: scroll your mouse wheel to zoom in and out smoothly around your cursor position while preserving chart context;
- Market Trading Volumes: semi-transparent daily volume bars in the lower quadrant (emerald for bullish days, coral for bearish sessions) visualize liquidity depth.
3. Execution Markers (B/S) & Volume Share
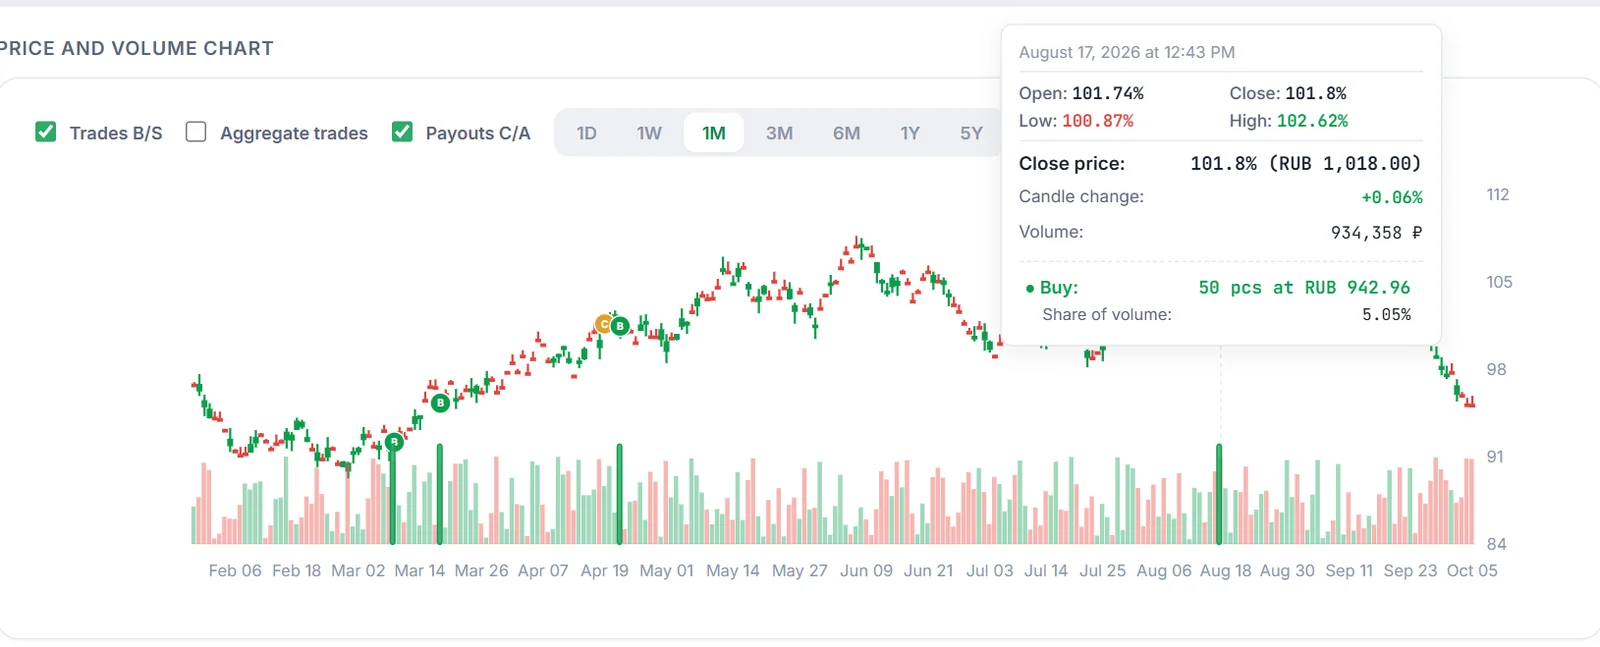
Enabling the “B/S Trades” toggle maps personal executions directly onto historical price movements:
- Buy & Sell Markers:
B(Buy) — position entry or accumulation (emerald badge with crisp white outline);S(Sell) — partial or complete exit (coral badge);- When buys and sells happen on the same candle, markers offset horizontally to avoid collision.
- “Share of volume:” Metric: tooltips calculate the exact percentage of the session's volume your execution represented. For bonds, the ruble trade value (the broker-reported amount, or else price in % of par × par × quantity; accrued interest is not included) is compared to session turnover; for equities, share counts are matched. Highly liquid securities use adaptive rounding (e.g.
~0.0002%); - Zero-Volume & Off-Exchange Handling: for OTC executions or non-trading days (weekends, synthetic transfer candles), Firewire calculates relative volume among your transactions (e.g.
100% (all volume)or50% (of candle volume)) with a clear0 ₽ (no market trades)notice; - Trade Aggregation: groups multiple partial fills of the same session into a single volume-weighted average price point;
- Keyboard Navigation Isolation: arrow key asset navigation automatically disables during active onboarding tours, open modals, or text input.
4. Coupon & Amortization Schedule (C/A)
The “C/A Payouts” option projects upcoming and historical cash flow dates onto the chart:
- Cash Flow Markers:
C(Coupon) — scheduled coupon interest distribution (amber marker);A(Amortization) — partial principal repayment date;
- Bi-Directional Highlight: hovering over any payment row in the table or matrix highlights the corresponding date on the price chart with a dotted reference line and anchor dot;
- Accrual Matrix: year-by-month cash flow calendar displays income seasonality and total scheduled inflows through maturity.
5. Analytical “Ruler” Measurement Tool
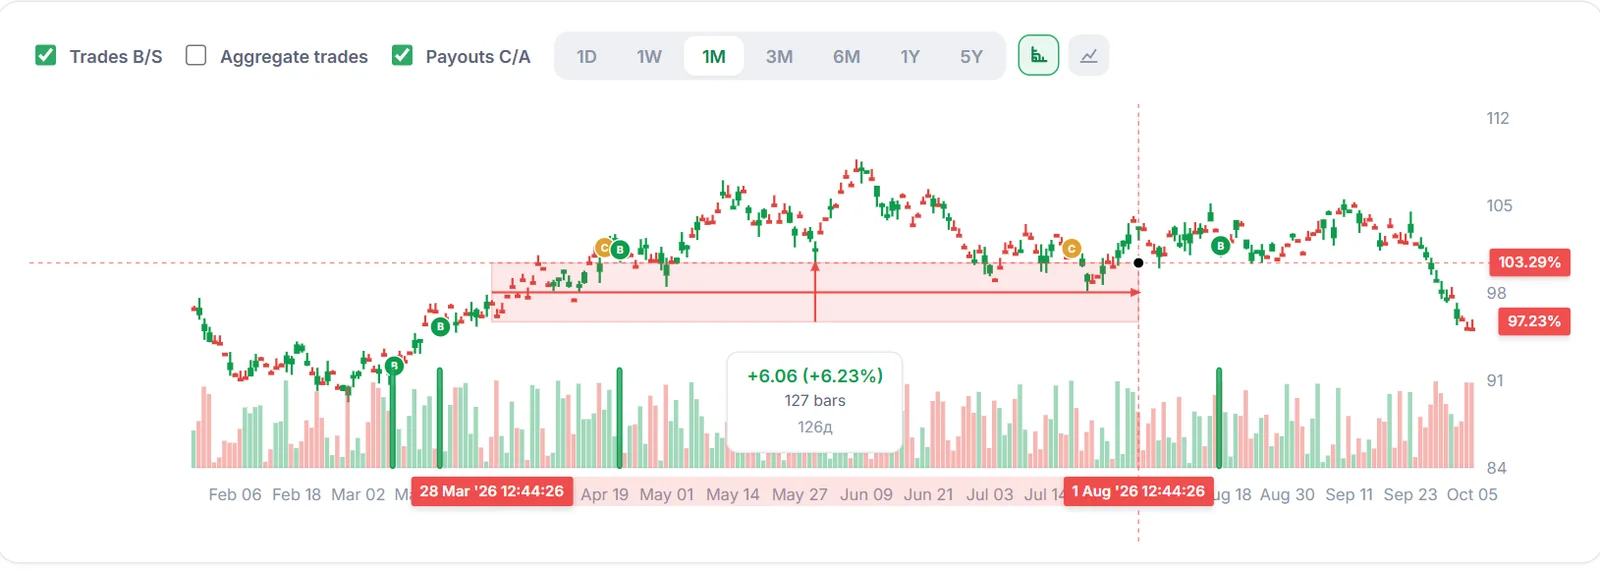
The Ruler tool empowers investors to gauge percentage returns and holding intervals across arbitrary ranges:
- Click the Ruler icon in the top-right toolbar of the chart;
- Hold the left mouse button on the start candle and drag to your target date;
- The chart displays a high-contrast shaded range with guide arrows and a central measurement summary:
- Price Change: absolute difference between end and start close prices;
- Percentage Return (%): relative growth or drawdown with color-coded badges;
- Elapsed Duration: exact time delta in days, hours, and minutes (e.g.
42d 6h); - Bar Count: exact number of market sessions within the selection;
- Press
Escapeor click the Ruler button again to cancel the measurement.
6. Bond Calculator & Yield Parameters
The built-in calculator estimates net yield before committing capital to a trade:
| Metric | Formula / Description | Practical Utility |
|---|---|---|
| Yield to Maturity (YTM) | Internal rate of return incorporating clean purchase price, coupon flow, and par repayment | Core benchmark to rank bonds with differing tenors and coupon structures. |
| Current Yield | Annualized coupon payments divided by clean purchase price | Measures immediate cash flow yield without capital gain/loss at redemption. |
| Accrued Interest (NKD) | Accumulated coupon earned by seller since last payment date | Determines the total dirty price settled upon execution. |
| Modified Duration | Price sensitivity to a 100 bp change in the bond's own yield to maturity | Assesses interest rate risk exposure under monetary policy tightening. |
| Z-Spread (G-Curve & Z-Spread) | Constant spread over the G-curve, the zero-coupon OFZ yield curve | Quantifies adequate credit risk compensation above risk-free sovereign debt. |
7. Frequently Asked Questions (FAQ)
Why are bond prices displayed as percentages on the chart?
Exchange standards quote bonds as a percentage of remaining par value (e.g. 95.50% of a 1,000 ₽ face value). Chart candles are shown in percent too; in tooltips Firewire converts the value of your trades into rubles using par value (without accrued interest). The ruble price of the bond is shown in the card header.
How can I reset chart zoom quickly?
Clicking any period button (e.g. 1M or 1Y) or scrolling the mouse wheel back to the boundaries resets the zoom to default full-span view.
Where are historical price candles sourced from?
Firewire first requests candles from the BCS broker gateway and, if it is unavailable, from the public Moscow Exchange API (MOEX ISS).
Can I rearrange blocks in the instrument card?
Yes. Click the “Customize” button in the top right (and “Done” when finished) to adjust width (1/4, 1/2, 3/4, or full width), height, or hide non-critical widgets.