

Credit Rating Allocation & High-Yield Bonds
Firewire Analytics categorizes bond holdings by credit rating tiers (AAA to High Yield). This page also explains convexity, which refines the duration-based estimate of interest rate risk.
1. Credit rating scale
- AAA / AA — highest reliability (OFZ, quasi-sovereign corporates);
- A / BBB — solid investment grade;
- BB and below (high yield) — higher default probability.
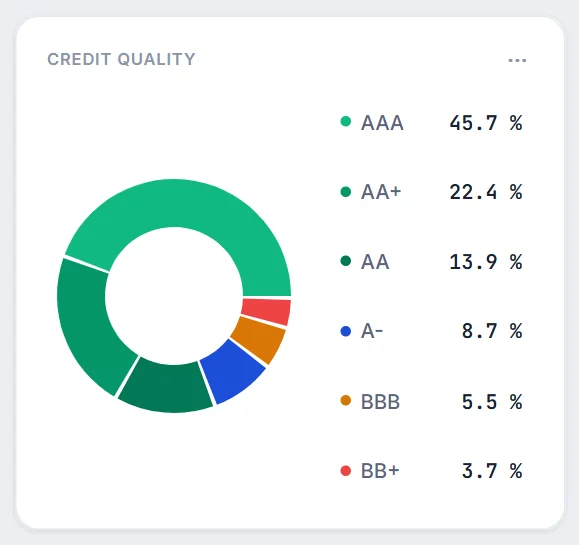
The credit ratings widget shows the share of the bond portfolio's value in each rating group: the sum of the current value of bonds with that rating divided by the value of all bonds.
2. Bond convexity
Duration treats the price–yield relationship as linear, while the real curve is convex. Convexity measures that curvature. For a single bond with price $P$, yield to maturity $y$ and cash flows $C_t$ in years $t$:
Together with modified duration $D_{\text{mod}}$ it gives a more accurate estimate of the price change for a yield shift $\Delta y$:
For an investor this means: with high convexity a bond gains more when rates fall and loses less when they rise than duration alone predicts. The effect matters for long bonds and sharp rate moves. Portfolio convexity is the value-weighted convexity of its bonds.
On the dashboard, portfolio convexity is shown in the “Duration & Rate Risk” widget next to duration and modified duration (a dash is shown when the portfolio holds no bonds). Its effect is also captured by the AI Copilot rate stress test, which fully reprices bond cash flows at the new yield.